Social percepts have been revealed with specially developed instruments and were analyzed by a range of parameters. While collecting and processing the data quality and quantity analysis data have been collected. For this purpose SPSS «Statistical Package for the Social Sciences» has been used.
The hypothesis on the existing relation between respondents’ proneness to the risk in physical danger situations and their percept of the direction and intensiveness of the use of technologies and products of digital economics has not been confirmed. Respondents of the selection according to individual & personal characteristics are not prone to risk and prefer definition, confidence and predictability of events. The possible interpretation of obtained results has been provided as opinions.
Introduction
The transition to digital economics is one of priority strategic tasks of the development of the Russian Federation. The successful development of digital economics will be mainly determined by social percepts, as well as by users’ confidence to new advantages and to new possibilities of the practical appliance of the more and more expanding spectrum of its products. Products of digital economics penetrate deeper and deeper in the common life of people – financial, consumer, educational, labor, leisure and other spheres. The market of products of digital economics becomes more personified, able to provide the consumer with just what he/she needs. People acquire new opportunities in the implementation of their needs. On the other hand, there are different risks and threats, referred to the implementation of digital economics. Psychological problems of the use of products of digital economics are referred to people’s non-readiness for the percept of new advantages and possibilities of its products, concentration on possible risks and threats, what can hinder the implementation of digital technologies and products in different spheres of human practical activities. Mentioned circumstances can also cause such process as desadaptation of a personality, confusion in the new world of digital technologies, blurring of the own ego interface. This stipulates the timeliness of studies of social percepts of technologies and products of digital economics by users, as well as of its individual & psychological correlates.
The task of empirical studies, carried out by authors, is to reveal the interrelation of some individual & psychological characteristics of users and of their social percepts of some technologies and products of digital economics.
Materials and Methods
- Synopsis of existing instruments
Instruments of the analysis of the subject of interest, existing in the research literature, refers, mainly, to the area of revealing of the attitude towards new technologies and products of digital economics. The survey of several methods is given in the work [1]. Venkatesh V. etc., аs well as Donat E. [2; 3] etc. questionnaires measure such characteristics as: expected performance, workload, social influence, terms, facilitating the use of technology, hedonistic motivation, cost, habit, intention to use and the frequency of use. In the semantic differential method of Vishwanath A. [4] the accent is made on the common evaluation, workload, usefulness, interest, cost and safety of the technology. The scale of Sinkovics R. and of his colleagues measures the attitude to the use of bank machines according to three characteristics – fear of mistake, non-confidence to machines, convenience [5]. Cox D.N. and Evans G. Write about the risk level, usefulness, profits from use, confidence to the information about new technology [6]. From Russian researchers a reference to the work should be made [7].
While developing methodic instruments for our work we have been basing, partially, on above mentioned methods, as well as on the analysis criteria, highlighted thereunder. Instruments of performed studies comprised both standardized tests for studies of individual & psychological characteristics of a personality, as well as methodic procedures, specially created for the purpose of studies and oriented to the revelation of social percepts of digital technologies by respondents. One of it offered respondents to reflect their perceptions of the use of digital technologies by 11 scales, among which were such as: «convenient-inconvenient», «economically profitable-economically non-profitable», «safe-unsafe». For the evaluation the 7 score scale was offered, where each pole comprised three different response options, as well as the choice possibility, depending on the intensiveness of such or such indicated parameter in conformity with respondents’ percept of its manifestations in daily practice and activities. Another author’s method («User’s Scale») respondents were offered to assess the intensiveness of their use of certain digital technologies in the daily life (оnline payments, car sharing, social networks etc.), аs well as the typical practice of their behavior if offered to provide their personal information on the site.
- Оriginality of approach
The originality of approach is as follows.
- For empirical studies were taken individual & psychological characteristics, which have not been considered earlier in relation to social percepts: proneness to risk; subjective control (externality/internality) level; rigidity, level of the total confidence/non-confidence of a personality towards him/herself/world/people.
- In social percepts of digital technologies is highlighted a range of parameters, which have not yet became an object of the sufficient number of studies, at least of ones of national scientists, among it: economic profit and credibility, modernity and innovativeness; use for health.
- The survey sample comprised employees of one organization, i.e. people, meeting and working together every day, connected by certain relations and common activities.
- Оrganization of psychodiagnostic studies
In the performed studies participated employees of a commercial organization, dealing with manufacturing and package of accessories for mobile devices. The total number of the sample was 33 people, among them 14 men and 19 women. Age-related characteristics: 19-25 y.o. – 12 people; 26 — 31 y.o. – 10 people; 31 y.o. and older — 11 people. The experience of professional activities of employees was determined by the number of years, which varied from 1 to 3 years. The education level of the sample was: secondary – 10 people, secondary vocational education – 12 people, higher and incomplete higher education – 11 people. The classic “paper-pencil” option was selected. Studies were performed in group, when all members simultaneously fill the questionnaire, which comprised 6 methods and started with the General instruction.
For empirical studies were selected following individual & psychological characteristics: level of total confidence of a personality towards his/herself /world/people; proneness to risk; subjective control (externality/internality) level; rigidity. As instruments for the revealing of the interrelation of proneness to risk of users of technologies and of products of digital economics, on the one hand, and the direction and intensiveness of use of certain technologies and products on the other hand were used Меthods of diagnostics of the level of readiness to Schubert’s risk [8] and User’s scale (аuthor’s method), accordingly.
- Description of used methods
Меthods of diagnostics of the level of readiness to Schubert’s risk. Меthods allow to assess peculiarities of human behavioral reactions in situations, referred to uncertainty, danger to life, requiring the breach of established norms, rules. Тhe test comprises 25 questions, for each of these is offered one of five options of replies, characterizing the respondent most precisely: from the full consent to the steady “no”. The data has been processed in conformity with the offered key.
As a second diagnostic instrument at the second stage of studies was selected such especially created author’s method as «User’s Scale». It is oriented to the revealing of the frequency of use by respondents’ of most wide spread digital technologies. Besides that, it is offered to reveal respondents’ attitude towards such issue as personal safety in the digital space. The choice of namely such trends of the percept of digital technologies is stipulated by its intensive development among Russian users. So, the development of the e-commerce, namely, of the e-shopping, оpens larger opportunities for the purchase of goods and, nowadays, its scales already surpass purchases in ordinary shops [9; 10].
Respondents were offered to assess the intensiveness of use of five digital technologies in their daily life (оnline-payments, e-shopping, car sharing, online bank, social networks, as well as the typical practice of their behavior, when offered to provide the site with their personal information. Меthods comprise 5 affirmations in conformity with five selected digital technologies, which firs part means such or such direction and the second one – options of its use frequency. Example:
I buy in Internet (goods and services):
— never
— less often than once a year
— 1-2 times a year
— 1-2 times in a quarter (3-4 months)
— once a month
— once a week and more often
The sixth affirmation offers the user to assess the typical practice of his/her behavior, when offered to provide the personal information to the site. It assumes following reply options: I leave the site; I leave the information, but I change the data as much as possible; I leave the minimal information; I leave the information without any problems. In all six affirmations of the scale the respondent is offered to underline the selected option.
Instruction. Please, assess, how often in your life do you use following digital technologies. Underline the selected option.
Results and discussion.
Among 33 respondents 15 people have got average values of the level of readiness for risk ( -10 \ + 10 scores) (45,5%), 11 people have got the level of readiness for risk lower than the average one (-30 \ -11 scores) (33,3%) and 3 people have got the low level of the readiness for risk (lower than -30) (9%). So, most respondents showed a rather low level of the readiness for risk: among 33 respondents only three are ready for risk above average values (9% — have got +10 \ +20 scores), and only 1 person showed high results in questions on the level of readiness for the risk (more than 20 scores). It can witness, that respondents of this sample, according to their individual & personal characteristics, are not prone to the risk is situations, assuming the physical danger, and prefer certainty, confidentiality and predictability of events.
Such coherence of individual characteristics can be somehow explained by the identity of performed activities: let’s remind, that all our respondents are employees of the same organization and carry out the work, referred to the manufacturing, package and sorting of accessories for mobile devices. The head of the organization has been selecting the personnel just for such qualities – mind equableness, ability for monotonous tasks, non-proneness for sudden and risky activities.
At the figure 1, is shown the distribution of respondents by answers, while using Меthods of diagnostics of the level of readiness to Schubert’s risk.
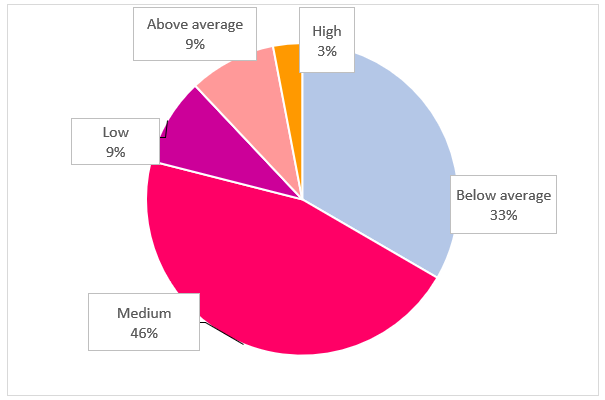
Figure 1. The distribution of respondents ‘ answers using the Methods of diagnostics of the Schubert’s degree of risk preparedness
At the first stage of the processing the decision was made to use the data from five of mentioned (same type) questions, referred to respondents’ percept of the direction and frequency of use of digital technologies («User’s Scale” method). Obtained results of enquiry are given on figures 2-6.
We see that the most spread of values is obtained at responses to the question about purchases of goods and services in the Internet (see fig. 2).
Answers to other questions are rather uniform: most part of respondents use different online bank services once a week and more often – 61% (see fig. 3); 79% (26 people) never use car sharing services (see fig. 4); 64% (21 people) once a month make online payments (payment of municipal services, taxes, penalties etc.) (see fig. 5); 76% (25 people) use social networks several times a day (see fig. 6).
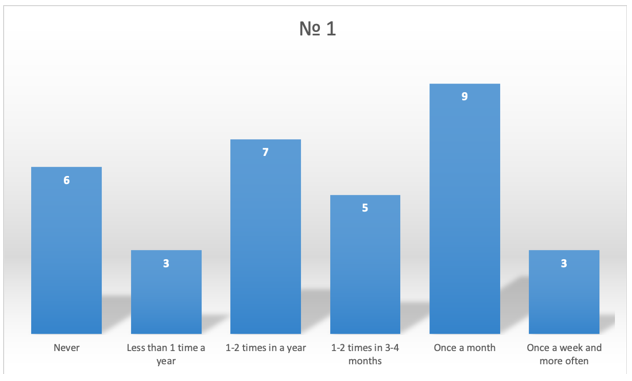
Figure 2. Distribution of answers to the question «I buy in the Internet (goods and services) …»
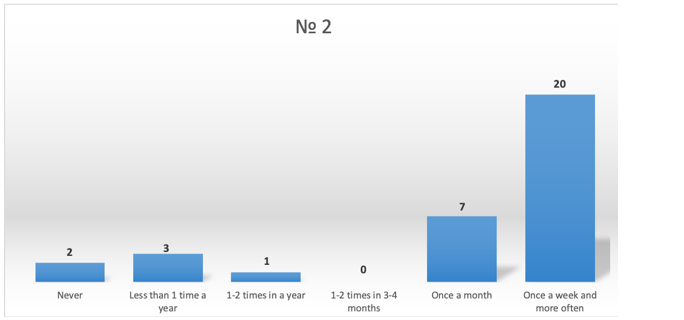
Figure 3. Distribution of answers to the question «I use different online bank services…»
This uniformity of answers, for example, to the Question 2 «I use different online bank services …», is more visualized on the next figure 7.
The distribution of answers № 6 «How do you usually act, if you are asked at the site to leave the personal information» is shown on the figure 8.
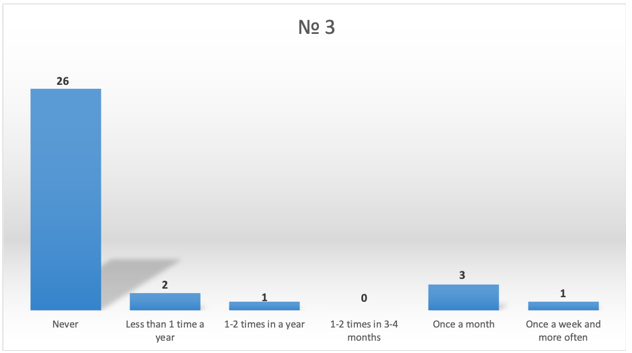
Figure 4. Distribution of answers to the question «I use car sharing services …»
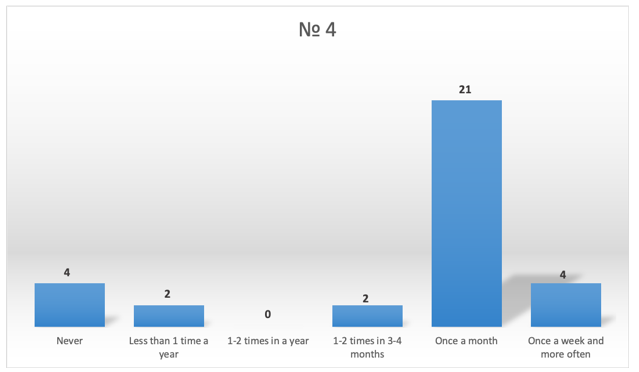
Figure 5. Distribution of answers to the question «I make payments (municipal services, taxes, penalties etc.) оnline…»
As we see, 63,6 % (21 people), while answering the question select the option «Leaving the site», 30,3 % (10 people) – «leave the minimal information».
The data obtained in conformity with Меthods of diagnostics of the level of readiness to Schubert’s risk has been compared with the data of the «User Scale».
The interrelation of the level of readiness for risk and of the frequency and direction of use of technologies and of products of digital economics by respondents.
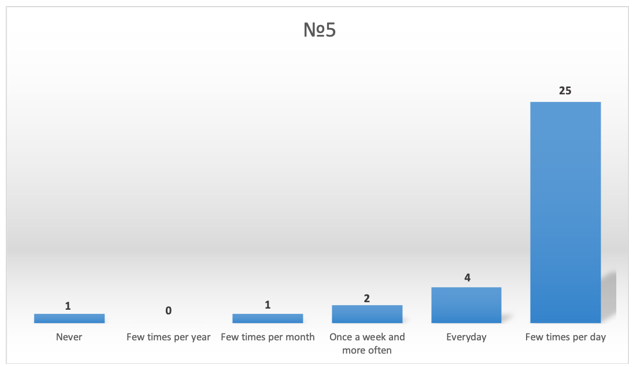
Figure 6. Distribution of answers to the question «I am using networks …»
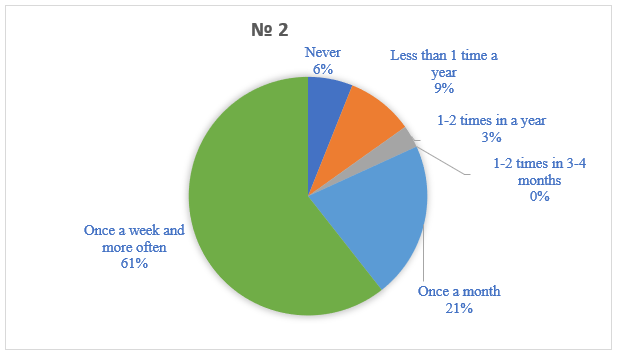
Figure 7. Distribution of answers Question: «I use different online banking services …».
For the verification was obtained the criteria for two unrelated samples – Mann-Whitney test.
Calculations with the Mann-Whitney test – respondents with low indices of the level of readiness to risk and respondents with high indices of the level of readiness to risk – did not show considerable differences in answers to the question about the frequency of use of digital technologies. For all questions, referred to the frequency of use of digital technologies, the asymptotic value proved to be more than 0,05 (see table 1). That means that there are no significant differences between groups. Opinion: the level of readiness to the risk in the whole this sample is not referred to the frequency of use of digital technologies.
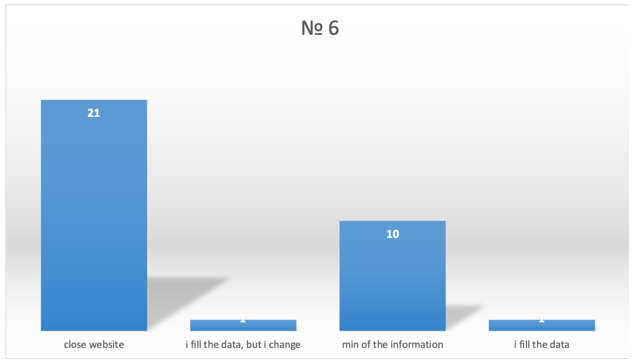
Figure 8. Distribution of answers to question No 6 «What do you usually do if you are asked to fill personal information about yourself on the website»
Таble 1
Statistic criteria (Маnn-Whitney) for the whole sample according to the method of diagnostics of the level of readiness for risk
| Criteria | Аsymptotic value
(bilateral) |
| Frequency of use of digital technologies | 0, 177 |
In the table 2 are given Cronbachs alpha values for four questions from the questionnaire (for the frequency of use of digital technologies). The Cronbachs alpha value was 0,552 (0,552 < 0,7), what means, that the scale is unreliable. Сonsequently, we check the interrelation between the frequency of use of a certain digital technology and the level of readiness for risk for each question separately.
Таble 2
Reliability statistics (Questions about the frequency of use of digital technologies according to methods of diagnostics of the level of readiness for risk
| Cronbachs alpha | N | |
| Questions for the frequency of use of digital technologies | 0,552 | 4 |
For the question «I make online payments» the asymptotic value was found to be more than 0,05 (see table 3). That means that there are no significant differences between groups. Opinion: the level of readiness to the risk in the sample is not referred to the frequency of use of this technology. The asymptotic value was found to be more than 0,05 (see table 3). That means that there are no significant differences between groups. Opinion: the level of the readiness for the risk in the sample is not referred to the frequency of use of such technology.
Таble 3
Statistic criteria (Маnn-Whitney) for the whole sample according to the method of diagnostics of the level of readiness for risk «I make online payments»
| Criteria | Аsymptotic value
(bilateral) |
| Frequency of use of digital technologies | 0, 069 |
The asymptotic value was found to be more than 0,05 (see table 4). That means that there are no significant differences between groups. Opinion: the level of readiness to the risk in the sample is not referred to the frequency of use of this technology.
Table 4
Statistic criteria (Маnn-Whitney) for the whole sample according to the method of diagnostics of the level of readiness for risk for the question «I buy goods in the Internet»
| Criteria | Аsymptotic value
(bilateral) |
| Frequency of use of digital technologies | 0, 663 |
The asymptotic value was found to be more the 0,05 (see table 5). That means that there are no significant differences between groups. Opinion: the level of readiness to the risk in the sample is not referred to the frequency of use of this technology.
Table 5
Statistic criteria (Маnn-Whitney) for the whole sample according to the method of diagnostics of the level of readiness for risk для вопроса «I use car sharing technologies»
| Criteria | Аsymptotic value
(bilateral) |
| Frequency of use of digital technologies | 0, 326 |
For the question «I use different online bank services» The asymptotic value was found to be more the 0,05 (see table 6). That means that there are no significant differences between groups. Opinion: the level of readiness to the risk in the sample is not referred to the frequency of use of this technology.
Table 6
Statistic criteria (Маnn-Whitney) for the whole sample according to the method of diagnostics of the level of readiness for risk для вопроса «I use different online bank services»
| Criteria | Аsymptotic value
(bilateral) |
| Frequency of use of digital technologies | 0, 778 |
So, the initial assumption as to the connection between the level of the readiness of respondents for risk and their percepts of the intensiveness of the use of digital technologies in their life has not been confirmed.
There are reasons to assume, that such data has been received in connection with a certain composition of the sample (the most part of respondents is not prone to risk). In following studies it is necessary to increase the number of respondents and to equate the proportion between different groups.
The obtained data can also witness, that the level of the readiness to risk in situations of the physical danger and of the percept of our respondents of the frequency and the direction of use of digital technologies have got different psychological determination. It is also possible, that digital technologies, offered in the “User’s Scale” method, digital technologies have already entered the daily life and so are not referred in our respondents’ percepts with such notion as risk. Probably, at next stages of study the «Scale..» should also include other technologies, which still did not become common, are referred to the risk concept and, according to the data of other studies, can cause the sense of danger and fear, as, for example, gene engineering technologies, invasive technologies and technologies, when your life depends on the artificial intellect: implanted health sensors, electronic microchips and mechanical devices, enlarging mental and physical abilities etc.; genetically modified foodstuffs with improved qualities.
Conclusion
Results, obtained in the course of studies, allowed to formulate following opinions.
- The selection of sample represented employees of a single organization, i.e. people, everyday meeting and working together, engaged in certain relationship and common activities. That allowed to determine more clearly the structure of social percepts, to reveal its core, consolidating components, which were just related with the group unity.
- For empiric studies were taken individual & psychological characteristics, which have not been considered earlier in relation with social percepts: proneness to risk; level of the subjective control (externality/internality); rigidity, level of total confidence/non-confidence of a personality towards him/herself/world/people.
- Selection of trends of digital technologies for the revealing of social percepts has been stipulated by its intensive development among Russian users. So, the development of e-commerce, namely, e-shopping, opens unconditional terms of the purchase of goods and at the present time its scales already supersedes purchases in ordinary shops.
- The comparison of data, obtained with Меthods of diagnostics of the level of readiness to Schubert’s risk and «User’s Scale» did not confirm the initial hypothesis of the relation between the level of the respondents’ readiness to risk and their perception of the intensiveness of use of digital technologies in their life. There are reasons to assume, that such data has been obtained due to the certain composition of the sample (most respondents are not prone to risk). Maybe, obtained results (coordination of individual characteristics, impossibility to the researcher to assign groups of respondents with high and low values, for example, as to the proneness to risk) can be partially explained by the identity of performed activities, as well as by the conformity of management’s demands at the selection of the personnel.
- The obtained data can also witness, that the level of the readiness for risk in situations of the physical danger, as well as social percepts of our respondents about the frequency and direction of use of digital technologies have got different psychological determination. It is also possible, that digital technologies, offered in the “User’s Scale” method, have already enetered the daily life and, in this juncture, are not referred to the risk notion in our respondents’ percepts.
Acknowledgments.
The work has been performed with the financial support of the Russian Foundation of Fundamental Studies, project № 18-013-00669а «Studies of Psychological Mechanisms of Formation of Social Percepts and Confidence of Users towards Digital Economics’ Products».
Библиографический список
1. Nestik Т, 2018. Social & Psychological Predictors of a Personal.ity Attitude towards New Technologies. Informational Society: Education, Science, Culture and Technologies of the Future. Ed. 2. P. 309-319.2. Venkatesh V, Thong J, Xu X, 2012. Сonsumer acceptance and use of information technology: extending the unified theory of acceptance and use of technology. MIS Quarterly. V. 36. No 1. P. 157-178.
3. Donat E, Brandtweiner R, Kerschbaum J, 2009. Attitudes and the Digital Divide: Attitude Measurement as Instrument to Predict Internet Usage. Informing Science: the International Journal of an Emerging Transdiscipline. V. 12. P. 38-56.
4. Vishwanath A, 2014. The psychology of the diffusion and acceptance of technology. The Handbook of Psychology of Communication Technology. Ed. S.S. Sundar. Malden, MA: WileyBlackwell. P. 314-331.
5. Sinkovics R, Stottingen B, Schlegelmilch B, Ram S, 2002. Reluctance to Use Technology-Related Products: Development of a Technophobia Scale. Thunderbird International Business Review. V. 44. No 4. P. 477-494.
6. Cox D, Evans G, 2008. Construction and validation of a psychometric scale to measure consumer’s fears on novel food technologies: the food technology neophobia scale. Food quality and preference. V. 19. P. 704-710.
7. Chiang I.-P, Su Y.-H, 2012. Measuring and Analyzing the Causes of Problematic Internet Use. Cyberpsychology, Behavior, and Social Networking. No 15(11). P. 591-596.
8. Encyclopedia of Psychodiagnostics. Psychodiagnostics of Adults, 2009. Bahrah-M Publishing House. Samara, Russia. 704 p.
9. Nestik Т, Zhouravlev А, 2018. Social & Psychological Determination of the Readiness of a Personality for the Use of New Technologies. Psychological Magazine. Vol. 39. No 5. P.5-14.
10. Patoshа О, 2018. Peculiarities of Purchases in the Internet. Internauka. No 46 (80). Pаrt 2. P. 14-15.
